Key Highlights
Content performance = how well your content reaches, engages, and drives outcomes—so you should track metrics that match your goal (awareness, traffic, leads, revenue).
The article groups 16 key metrics into: Engagement (views, new users, engagement time, bounce rate, social interactions), SEO + AI visibility (organic traffic, rankings, AI visibility, branded searches/mentions, impressions, clicks, backlinks), and Business impact (leads, conversion rate, ROI).
Use a balanced scorecard—don’t rely on one number; combine engagement + discoverability + conversions to see what’s working and what to optimize.
Introduction
Content performance is about understanding how well your articles, videos, and other assets attract and engage your target audience—and drive action. Using content performance analytics, marketers track key metrics like visibility, views, engagement, and conversions, then connect these to outcomes such as brand awareness, website traffic, and lead generation.
By regularly analysing these metrics, you can see what’s working, what’s not, and refine your content strategy so it better supports your business goals.
Why Should You Track Content Performance?
Before launching your content performance analysis, be clear about what you want to achieve—more traffic, more leads, or more customers. Then define the right key performance indicators (KPIs) and metrics to track, such as time on page, bounce rate, new visitors, lead volume, and conversion rates, so you can measure whether you’re on track.
A clear content performance analysis plan helps you track the right metrics, identify trends, and make better decisions to improve your content marketing. Tools like Google Analytics show how users interact with your content and which tactics are working. By reviewing these content metrics regularly, you can refine your approach so every piece of content supports your business goals and delivers real results.
Tracking content performance matters because it shows what’s working, what isn’t, and where to improve. It provides valuable insights to refine campaigns, optimize tactics, and justify how resources are used—ultimately strengthening the overall content strategy.
Here’s an example:
Marketing platform HubSpot reviewed its blog analytics and saw that posts with short paragraphs, clear subheadings, and bullet points consistently drove more traffic, social shares, and form fills than denser articles. So, the team systematically updated existing posts to improve readability and structure, then applied the same format to new content.
The result?
HubSpot increased their blog traffic by 106% by focusing on readability optimization.
Their social sharing buttons led to 23% more social media engagement.
Result: 300% increase in lead generation from blog content within 12 months.
[source: Content Promotion Strategies: 11 Expert Tactics to Boost Traffic & Engagement]
Setting Up a Measurement Plan
Before launching your content performance analysis, be clear about what you want to achieve—more traffic, more leads, or more customers. Then define the right key performance indicators (KPIs) and metrics to track, such as time on page, bounce rate, new visitors, lead volume, and conversion rates, so you can measure whether you’re on track.
A clear content performance analysis plan helps you track the right metrics, identify trends, and make better decisions to improve your content marketing. Tools like Google Analytics show how users interact with your content and which tactics are working. By reviewing these content metrics regularly, you can refine your approach so every piece of content supports your business goals and delivers real results.
Key Content Marketing Performance Metrics to Track
The best content marketing key metrics depend on your goals, but often include views, organic traffic, AI visibility, and return on investment (ROI). Custom reports help you focus on the metrics that matter most to your business by applying filters and creating tailored views for deeper insights.
Here are 16 key performance metrics to consider tracking. Be sure to monitor different content formats to see which types—such as various subject lines, post styles, or media—perform best for your audience:
Engagement Metrics
Engagement metrics like views and bounce rate show how users interact with your content and whether it’s capturing attention. Making content compelling encourages visitors to stay longer and engage more with your site.
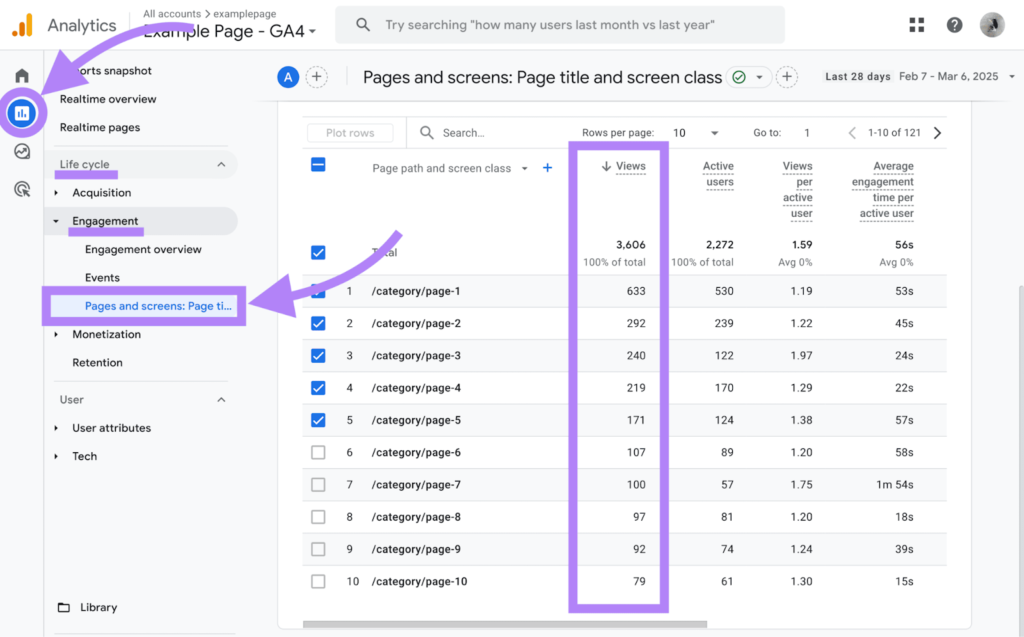
Views
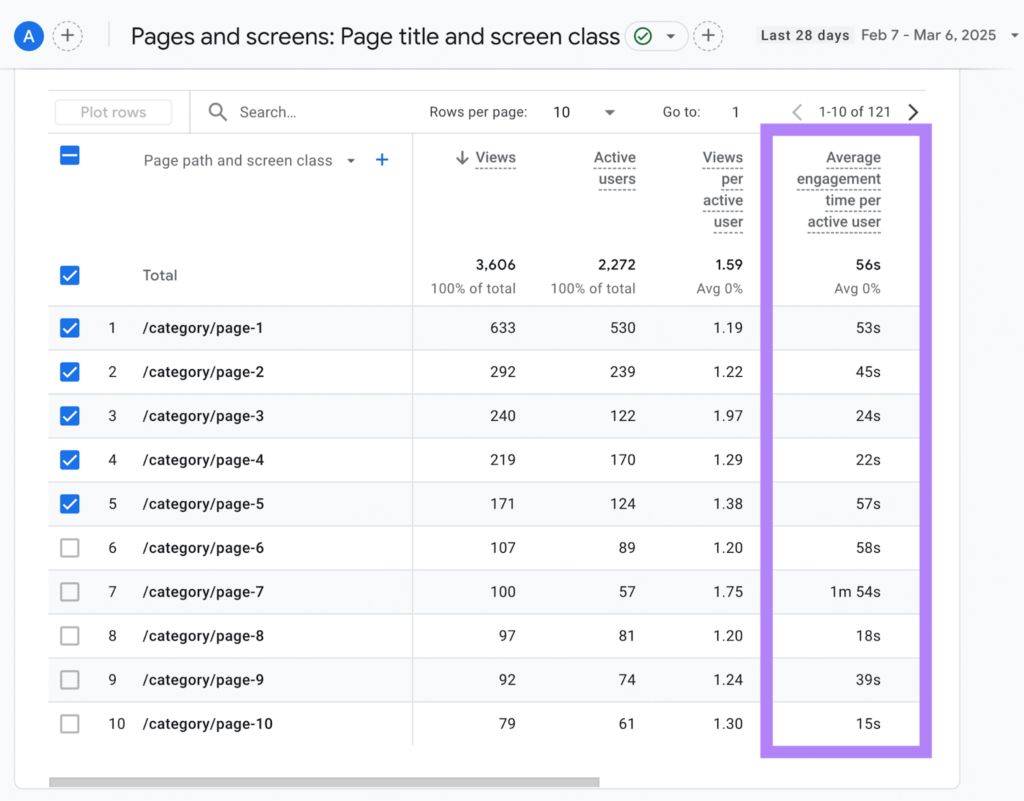
Views are the number of times a page on your site is loaded. In Google Analytics 4 (GA4), tracking views helps you spot which topics and pages are most popular.
To find them, go to Reports > Life cycle > Engagement > Pages and screens, then check the “Views” column to see which pages attract the most attention.
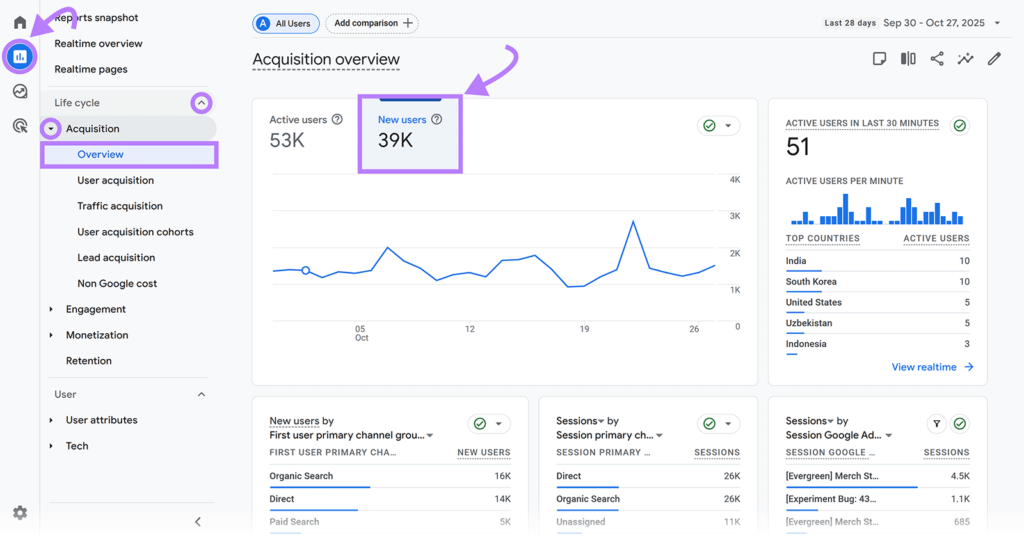
New Users
New users are first-time visitors to your site and show whether your content is attracting fresh audiences—a key metric now that many people use AI tools for answers instead of visiting websites.
In GA4, you can find new users under Reports > Life cycle > Acquisition > Overview, then click “New users.”
Average Engagement Time
Average engagement time shows how long users actively interact with your content. Higher times usually mean your pages are more relevant and engaging.
In GA4, go to Reports > Life cycle > Engagement > Pages and screens, then check the “Average engagement time per active user” column.
Bounce Rate
Bounce rate shows the share of visitors who leave your site without really interacting or spending much time there. Pages with high bounce rates often signal a mismatch between your content and what users expected or were searching for, so they’re good candidates for optimization.
In GA4, a session is treated as a bounce if it:
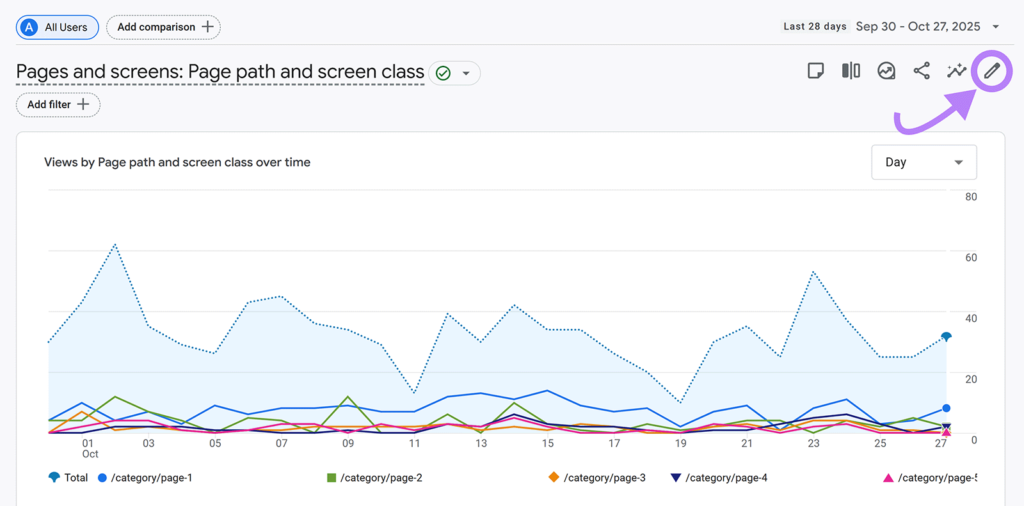
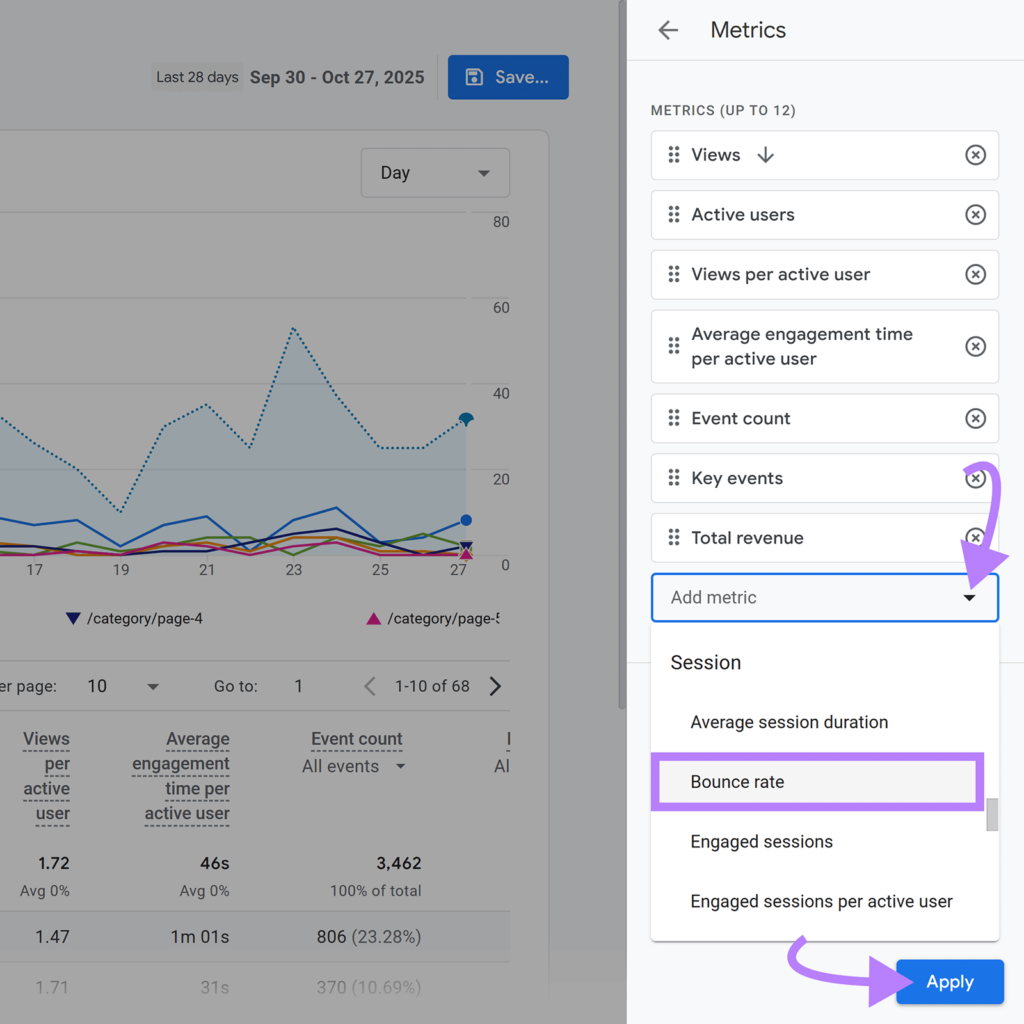
To check bounce rate in GA4, go to Reports > Engagement > Pages and screens, then use the pencil icon to customize the report and add the bounce rate metric.
Click “Metrics” in the right sidebar. Then, click “Add metric” to add bounce rate as a metric.
Likes, Comments, and Shares
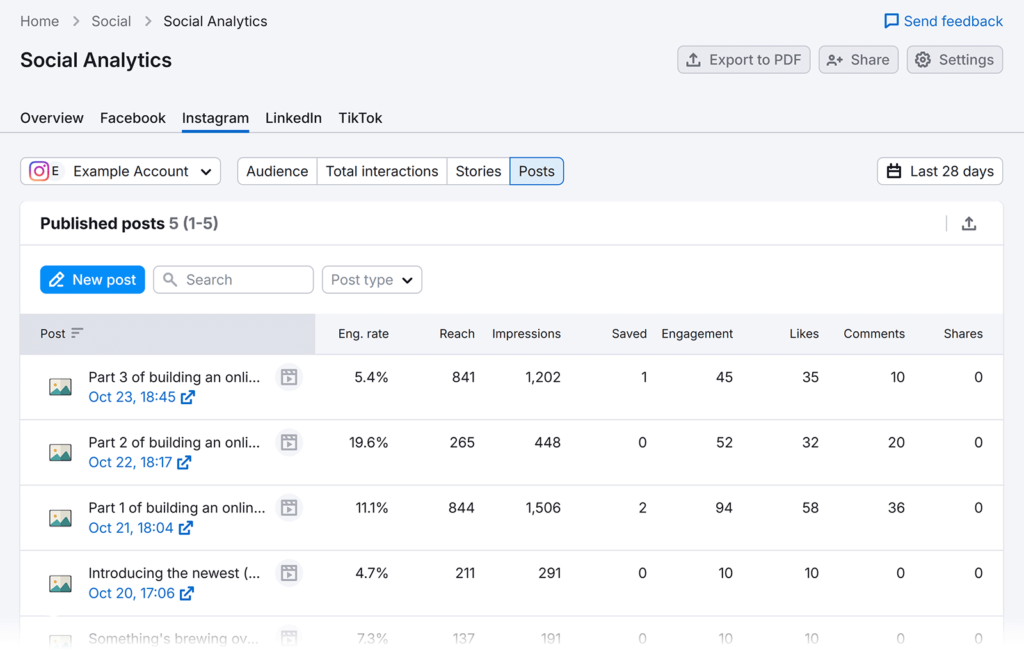
Likes, comments, and shares show how well your content resonates with social media users.
Monitor these metrics directly with social media platforms’ built-in analytics or with a tool like Social Analytics (included in the Semrush Social Toolkit), where you can view high-level analytics or drill down by platform and post.
SEO and AI Visibility Metrics
SEO and AI metrics, like organic (unpaid) traffic, keyword rankings, and AI search visibility, measure your content’s prominence and performance in search engine results pages (SERPs) and AI tools like ChatGPT, highlighting the importance of optimizing for search engines to increase organic visibility.
Organic Traffic
Organic traffic measures the number of visitors who find your site through unpaid search engine results. This metric can indicate how well your content ranks and attracts users.
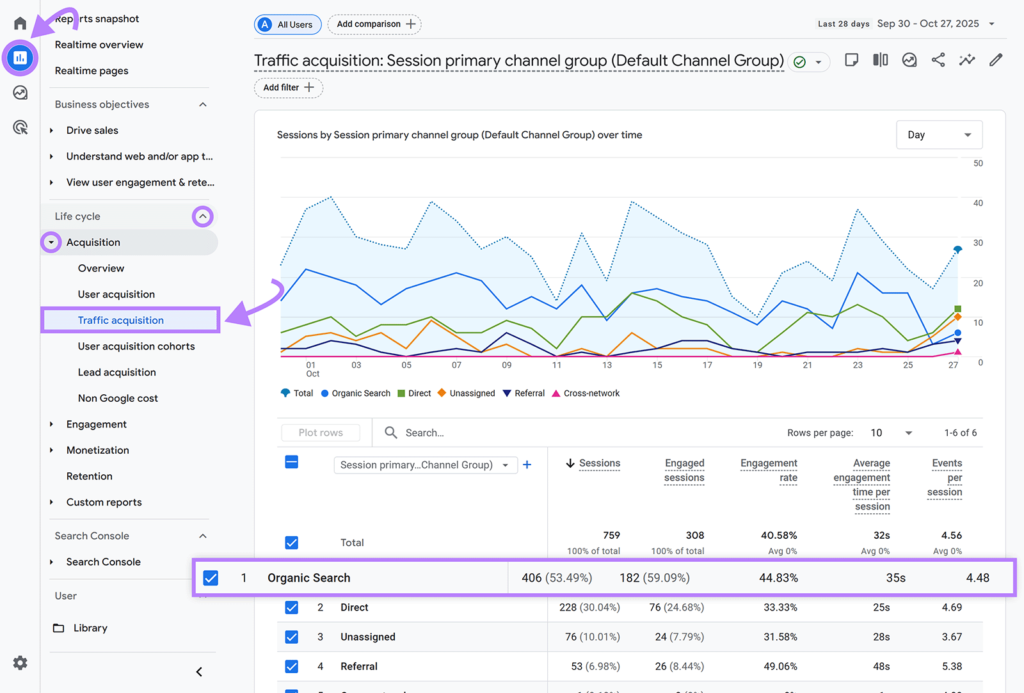
Learn your site’s organic traffic in GA4 by going to “Reports” > “Life cycle” > “Acquisition” > “Traffic acquisition.” Look for the table row labeled “Organic Search.”
Next, break down your organic traffic by page. So you know the specific content that’s resonating with your audience.
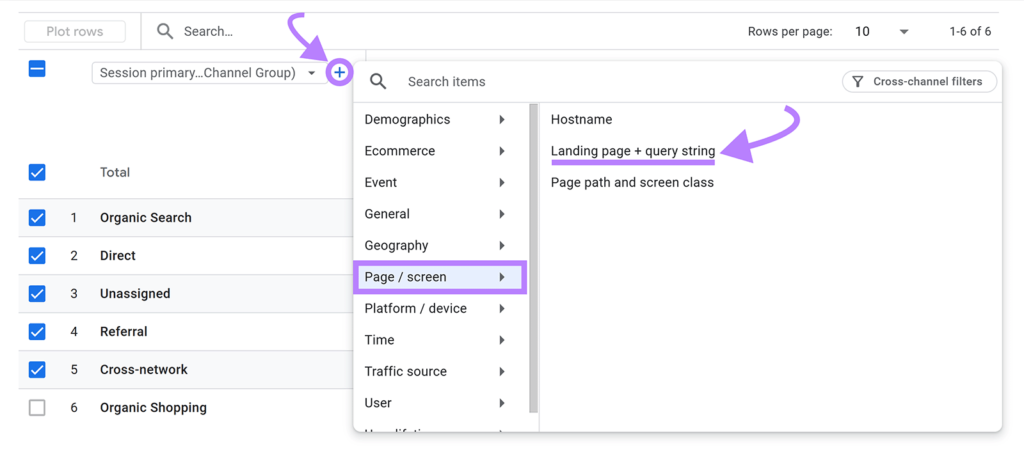
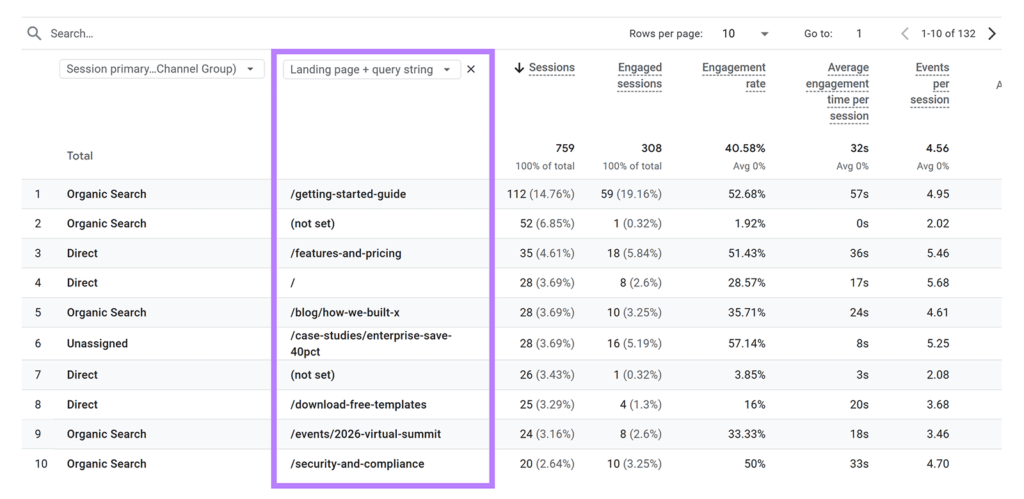
Click the “+” next to the “Session primary…Channel group)” table heading, and select “Page / screen” > “Landing page + query string.”
You’ll see the URL slugs of the pages bringing in the most organic traffic.
To better understand the true reach of your content, track unique visitors for each page. This metric shows how many individual users are engaging with your content, giving you a clearer picture of your audience size compared to just looking at pageviews.
Just be aware that most brands are seeing significant impacts on their organic traffic with the rise of AI search. In fact, Wikipedia has seen an 8% traffic decrease from this time in 2024 that they think is largely due to AI search.
The rise in AI search means it’s important to consider your organic traffic in tandem with other metrics to get a complete picture of your performance.
Keyword Rankings
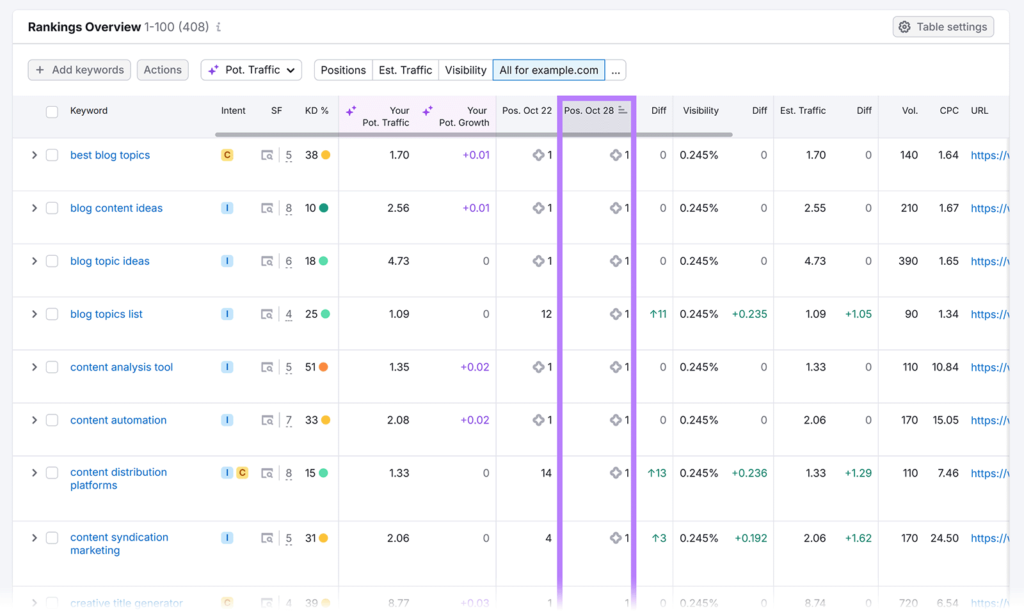
Keyword rankings measure your content’s position in SERPs for specific keywords, revealing your SEO strategy’s effectiveness in targeting desired terms.
Use Semrush’s Position Tracking tool to monitor keyword positions and track changes over time. So you can gauge optimization progress. And compare your rankings against competitors’.
AI Visibility
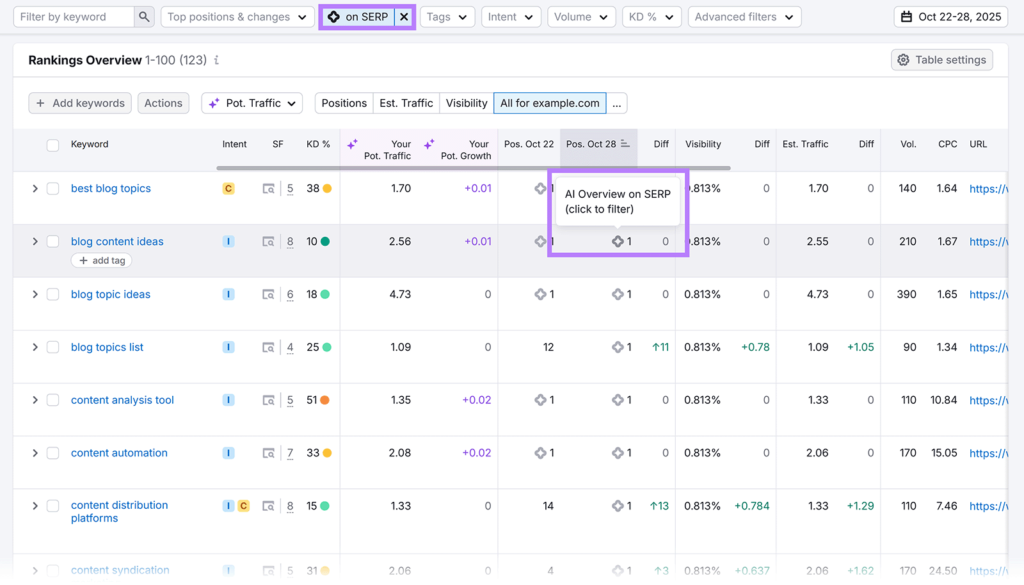
AI visibility measures how prominent your brand is in AI-generated responses, such as Google’s AI Overviews, ChatGPT, and Gemini.
Semrush’s Position Tracking tool monitors whether your pages appear in AI Overviews for tracked keywords, helping you measure visibility within AI-enhanced SERPs.
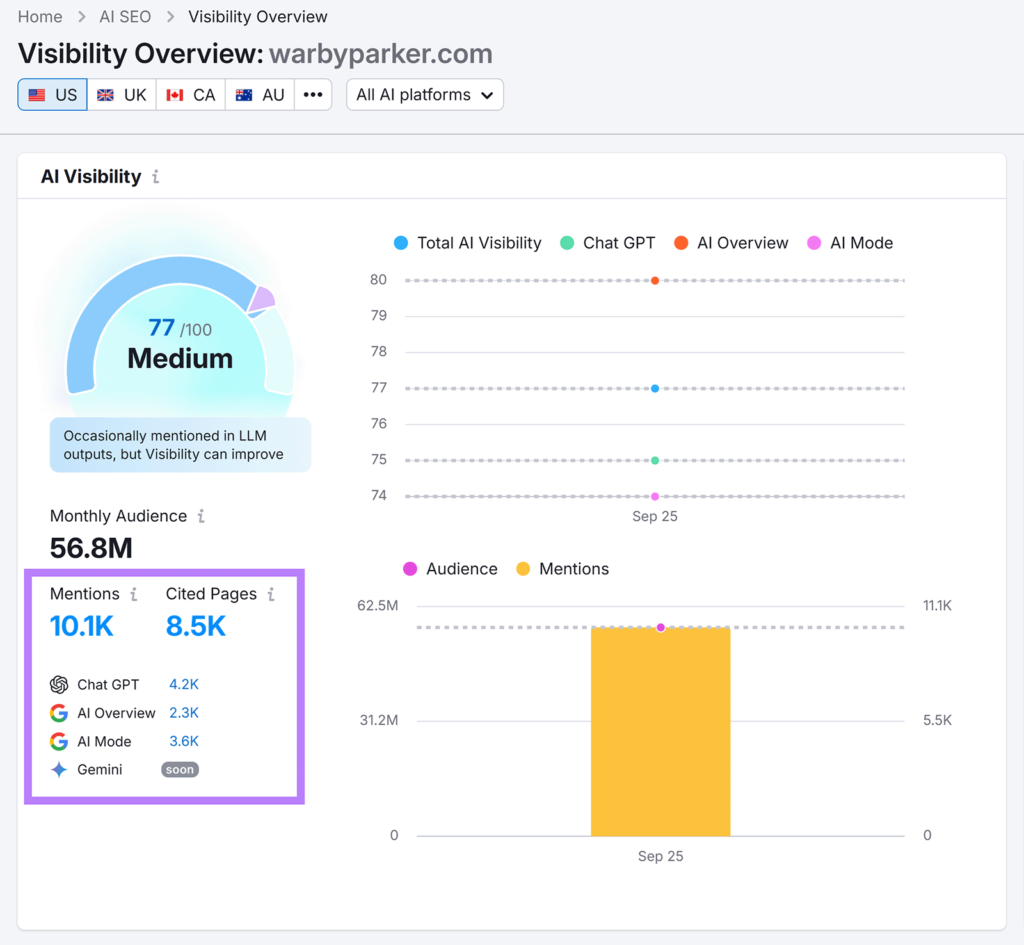
Meanwhile, the AI Visibility Toolkit’s “Visibility Overview” report tells you how often AI tools mention your site in their responses.
The AI Visibility Toolkit also shows the prompts that lead to mentions of your site, and the specific pages cited.
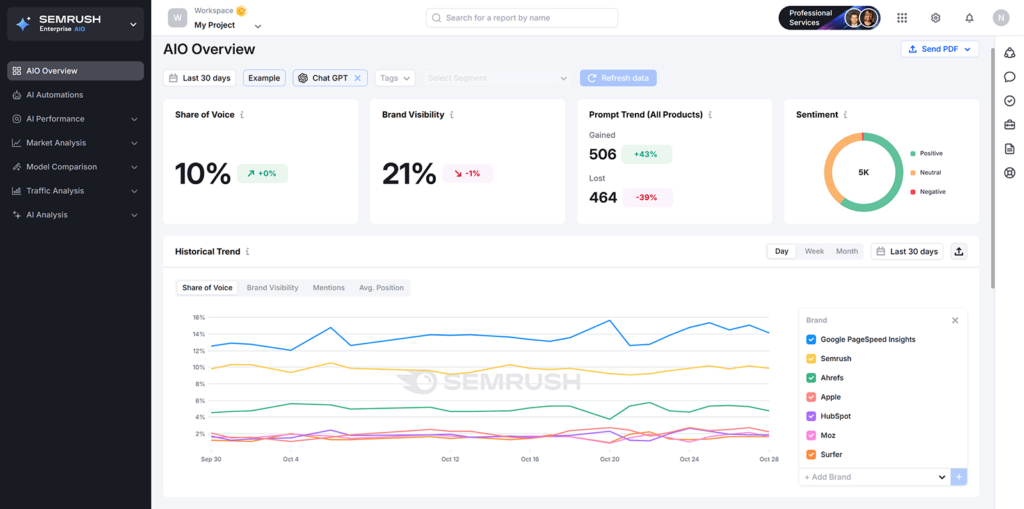
Last but not least, Enterprise AIO helps larger sites track their brand mentions by AI tools, analyze these mentions’ sentiment, and compare their AI visibility against competitors’, among other features.
Branded Searches
Branded searches are searches containing your brand’s name or a close variation.
Changes to branded search volume could indicate your content’s effectiveness in maintaining or growing brand awareness (via SERPs, AI tools, or other sources), because users can’t search your brand if they aren’t aware of it.
Branded searches can also indicate the topics involving your brand that users are interested in, which can inspire your content creation efforts.
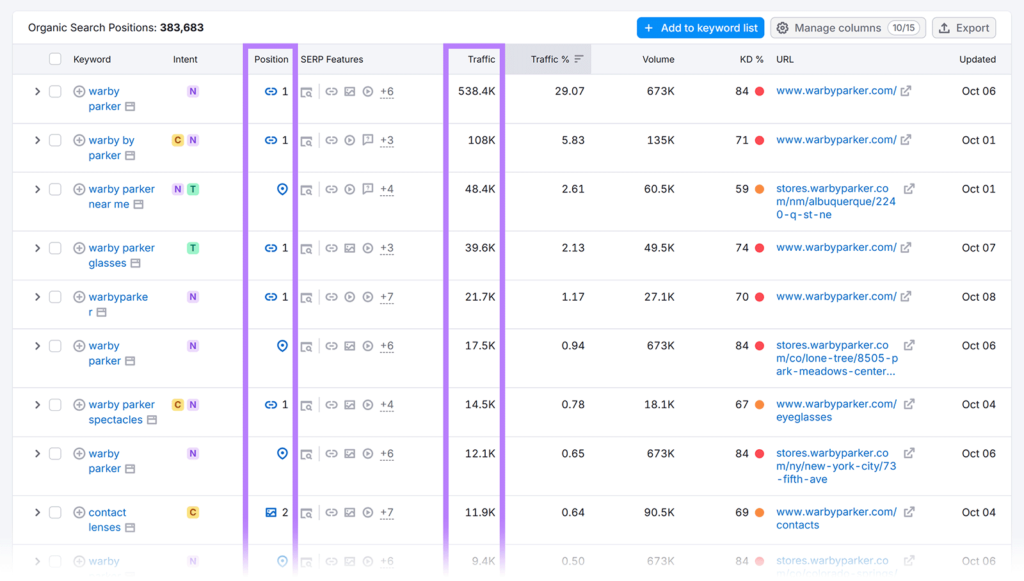
To track branded searches, use Organic Research. Which can monitor your rankings for and traffic from branded searches.
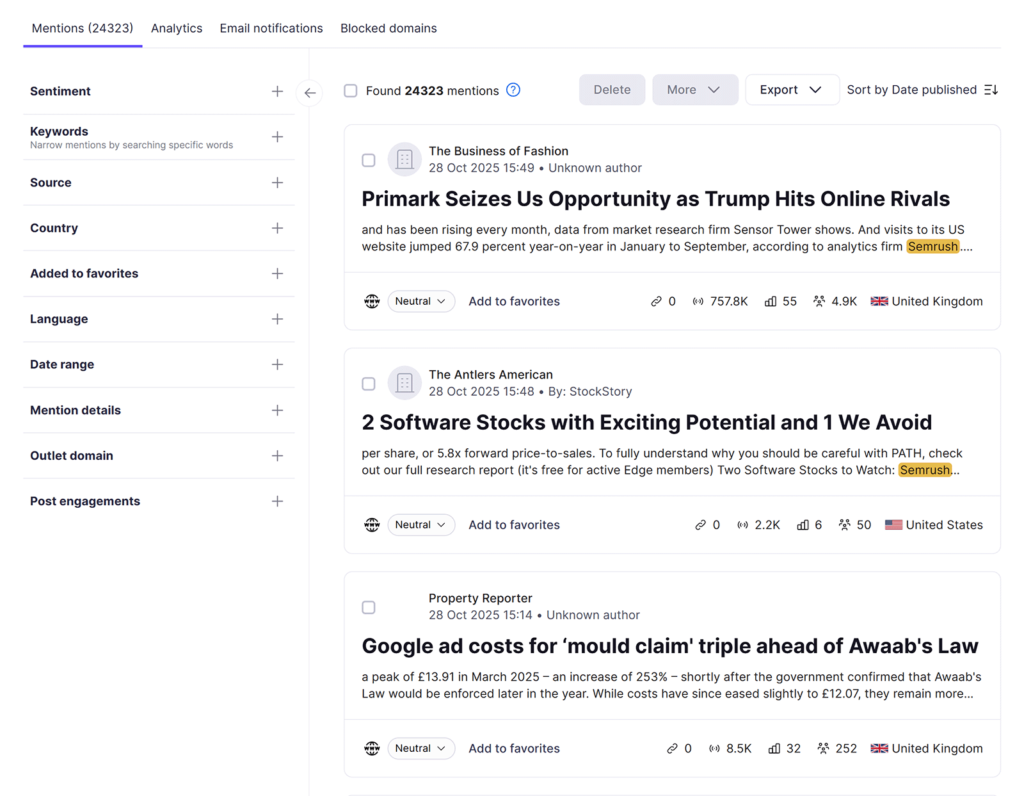
Brand Mentions
Brand mentions are references to your brand or your published content on external sites. Monitoring these mentions can sometimes reveal user interest in existing content, which helps you identify and replicate campaigns with high engagement.
Semrush’s Brand Monitoring app makes monitoring brand mentions easy. It lets you filter mentions by platform (e.g., LinkedIn) or content type (e.g., blog references), which can be used to see where your articles get shared or cited. Frequent mentions of a specific blog post signal audience interest.
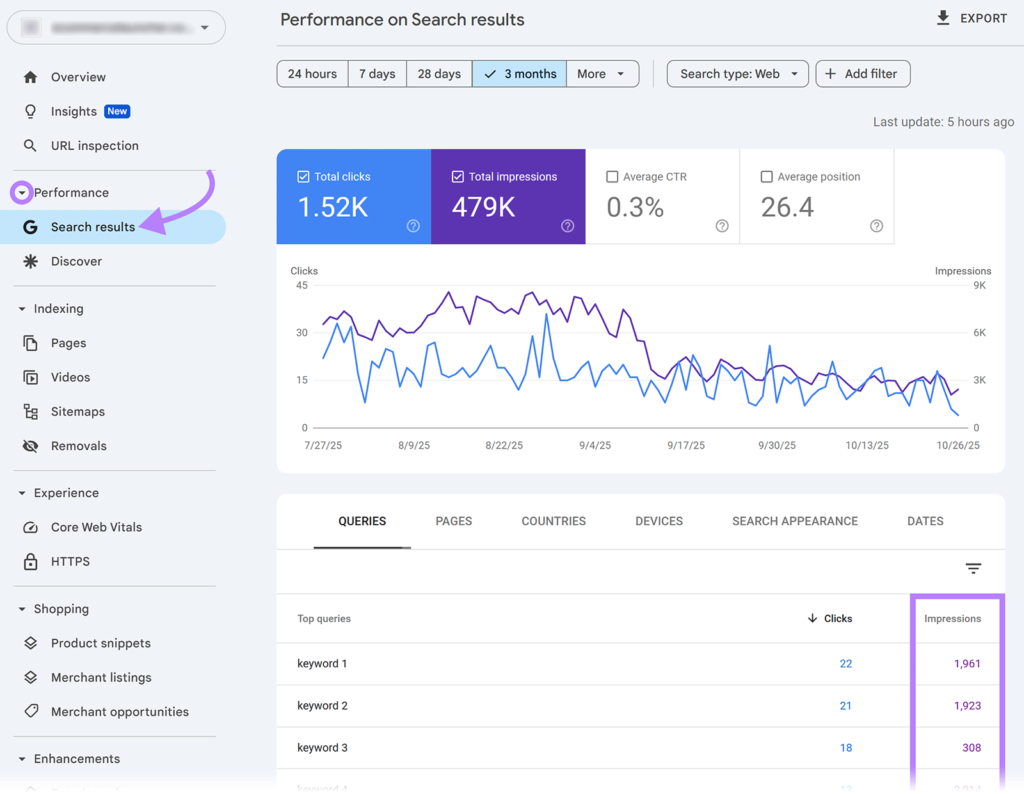
Impressions
Impressions are the number of times your content is displayed in search results like those Google provides, indicating your content’s visibility.
Find your Google Search impressions in Google Search Console (GSC) by clicking “Search results” and scrolling down to the report. View impressions by query (keyword), page, country, device, search appearance, and date.
Clicks
Clicks to your pages from SERPs can signal the effectiveness of your content’s title tag, meta description, and schema markup in producing organic listings that attract clicks.
View your clicks report from GSC’s “Search results” tab. You’ll see your clicks by query (keyword), page, country, device, search appearance, and date. Monitoring your click through rate here helps you measure the percentage of users who click on your content after seeing it in search results.
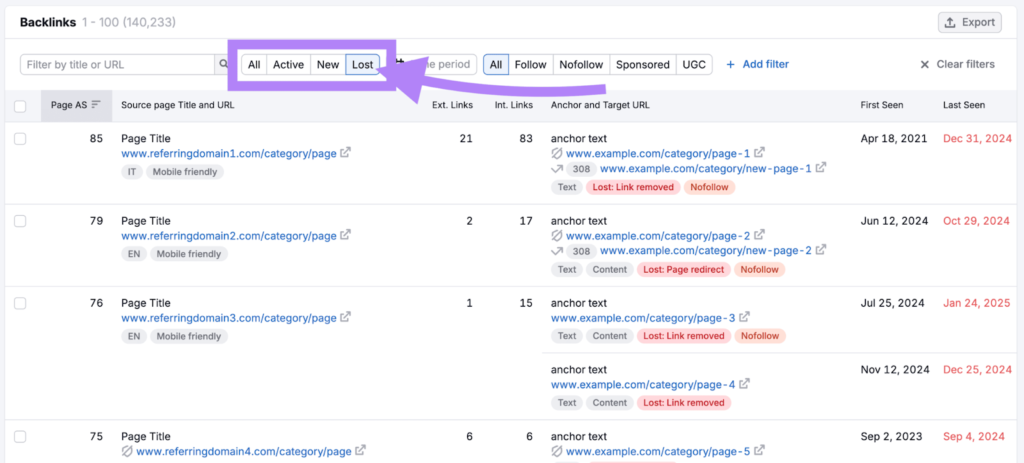
Backlinks
Backlinks are links from other websites to yours and act as trust signals that can boost your search rankings. Monitoring your backlinks alongside competitors’ helps uncover new link-building opportunities.
For instance, if a high-authority site links to a competitor but not to you, you can target it with outreach or content to earn a similar link and grow your authority.
You can track backlinks (including competitor links and lost links) using tools like Semrush’s Backlink Analytics, then work to replace or reclaim valuable links.
Conversion and Revenue Metrics
Tracking these metrics shows your content’s effectiveness in getting users to take desired actions.
Leads
A lead is a contact with high potential to become a customer. Monitoring lead generation reveals how well your content attracts prospective buyers to support business growth.
For example, software company Contentsquare uses a “demo request” button on blog posts to gather leads. Like this:
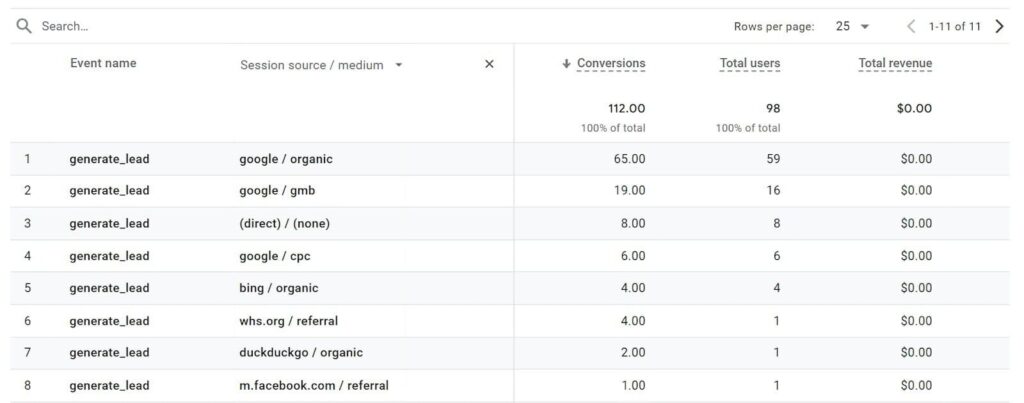
Conversion Rate
Conversion rate is the percentage of users who complete a desired action, like registering for your webinar or placing an order. Tracking conversion rates shows how effectively your content drives user action.
Track conversion rates (also known as key events) using GA4.
First, set up conversion tracking in GA4. Then, click “Reports” > “Engagement” > “Conversions” to view your conversion reports:
Return on Investment (ROI)
Return on Investment (ROI) measures the profitability of your content efforts. Regularly reviewing these efforts can help with budget allocation, letting you invest more in content strategies that drive revenue.
Calculate ROI using the formula:
ROI = (Net Profit / Cost of Investment) x 100%.
Let’s say you spend $500 on content creation and earn $2,000 in revenue from these efforts. Your net profit is $1,500 ($2,000 – $500).
That’s an ROI of 300%. This indicates that your content investment is paying off.
Summary
Ultimately, measuring content performance requires a comprehensive approach that goes beyond simple traffic numbers. By tracking a balanced set of metrics across engagement, discoverability (including search and AI visibility), and business outcomes, you can clearly see what resonates with your audience, what drives meaningful actions, and where to optimize for stronger results over time.
Remember, content measurement is an ongoing process that requires regular review and refinement. Continuously monitor key signals like engagement time, rankings, impressions, clicks, leads, and ROI (Return on Investment), then adjust your content strategy based on what the data reveals. With consistent tracking and iterative improvements, you can build content that performs better, supports growth, and delivers long-term value.
Frequently Asked Questions
What does “content performance” mean?
It’s how well your content reaches the right audience, keeps them engaged, and supports outcomes like sign-ups, enquiries, or sales.
Which metrics should I track first?
Start with a balanced set across engagement (views, engagement time), discoverability (organic traffic, rankings, impressions/clicks), and outcomes (leads, conversion rate, ROI (Return on Investment).
Is high traffic enough to call content “successful”?
Not always. High traffic matters, but success also depends on whether readers stay engaged and take meaningful actions (e.g., subscribe, download, request a demo).
What is AI visibility and why should I care?
It reflects how often your brand/content shows up in AI-generated answers. It matters because some users get information from AI summaries without visiting traditional search results.
How can I improve underperforming content?
Refresh the headline and intro, strengthen search intent match, add clearer structure (subheadings, visuals), improve internal links and calls-to-action, and update outdated sections—then re-check results after a few weeks.